没收到验证邮件?请确认邮箱是否正确或 重新发送邮件
原标题:WIPO发布2017年全球知识产权报告

2018年3月21日,世界知识产权组织(WIPO)发布了2017年全球知识产权活动报告。报告指出,2017年,WIPO在专利、商标和工业品外观设计方面的知识产权服务的使用再创历史新高;中国成为通过WIPO提交国际专利申请的第二大来源国,逐渐逼近长期处于领先地位的美国。
2017年,2家中国科技公司是国际专利申请的最高记录者,其中华为排名第1、中兴排名第2,紧随其后的是英特尔、三菱和高通。
2017年,日本增长强劲,但是中国略胜一筹排名第2;按照当前的趋势中国有望在3年内超过美国,成为全球最大的PCT(Patent Cooperation Treaty)申请来源国。
整体而言,来自世界各地的发明人向WIPO提交了243500件国际专利,比上年增加4.5%,这得益于中国和日本的强劲增长。WIPO国际商标申请(马德里体系)增长了5%,包含56200项申请,而由WIPO工业品外观设计注册(海牙体系)数量增长3.8%,达19429件。这标志着WIPO三大申请体系连续第8年保持增长。
1、专利
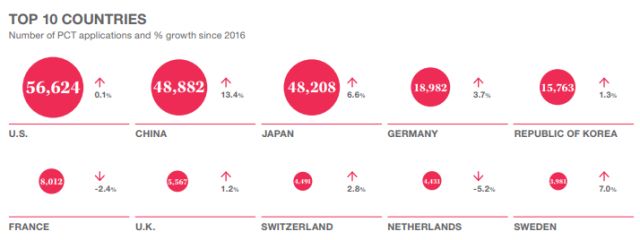
2017年,美国PCT申请位居全球首位(56624),其次是中国(48882)、日本(48208)、德国(18982)、韩国(15763)。中国和印度是PCT申请前15名中仅有的两个中等收入国家。2017年提交的PCT申请中,近一半来自亚洲(49.1%),欧洲(24.9%)和北美(24.2%)各占1/4。
Top15来源国中,中国是唯一一个年增长率达到两位数的国家(+13.4%)。自2003年以来,中国每年的年增长率都超过10%。瑞典(+7%)和日本(+6.6%)增长同样强劲,荷兰(-5.2%)和意大利(-4.5%)的申请量出现下降。
两家位于中国深圳的电信公司:华为(4024)和中兴(2956)的PCT申请量位居前两位;华为超过中兴夺回领先地位,后者2017年的PCT申请量大幅下降。其次是美国英特尔公司(2637)、日本三菱电机公司(2521)和美国高通公司(2163)。Top10申请人中包括7家亚洲公司、2家美国公司和1家欧洲公司。

就教育机构而言,2017年,加州大学PCT申请排名第1,拥有482件PCT申请,保持了自1993年以来的领先地位。麻省理工学院(278)位居第2,其次是哈佛大学(179)、德州大学系统(161)及约翰霍普斯金大学(129)。教育机构申请人TOP10由美国机构主导,Top20申请人中包含10所亚洲大学。牛津大学创新有限公司(Oxford University Innovation Limited)在教育机构中排名第24位,是排名最高的欧洲大学。
计算机技术(占总量的8.6%)超过了数字通信(8.2%),成为PCT申请量最多的技术领域。其次是电力机械(6.8%)和医疗技术(6.7%)。2017年,运输(+11.8%)、计算机(+11.4%)和生物技术(+9.6%)是Top10技术领域中增长率最高的领域。

2、商标
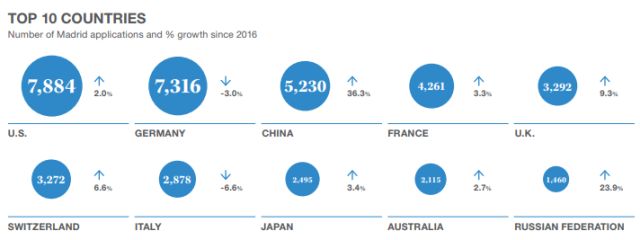
2017年美国提交的国际商标申请数量最多,为7884件,紧随其后的是德国(7316)、中国(5230)、法国(4261)和英国(3292)。
Top15来源国中,中国增长最快(+36.3%),其次是俄罗斯(+23.9%)、韩国(+9.8%)和英国(+9.3%)。中国和俄罗斯都是连续第二年取得两位数的增长。相比之下,奥地利(-4.9%)、意大利(-6.6%)和荷兰(-5.8%)的申请量均有所下降。
法国欧莱雅公司有198件申请,排名榜首,其次是匈牙利的Richter Gedeon Nyrt(117)、德国的ADP Gauselmann GMBH(104)、瑞士的诺华公司(96)以及欧洲的Abercrombie & Fitch Europe公司(82)。值得注意的是,Richter Gedeon Nyrt 2017年的申请量比上年增加了106件。Top15的申请人中包含12家欧洲公司、2家亚洲公司和1家美国公司。

国际商标申请中,计算机和电子类申请占总量的9.8%,其次是商业服务(7.9%)和技术服务类(6.2%)。Top10类别中,机械和机床(+13.4%)以及商业服务(+6.2%)的增长最快。

3、工业品外观设计
2017年,外观设计申请数量增长了3.8%,达19429件,与去年相比减少了5213件。
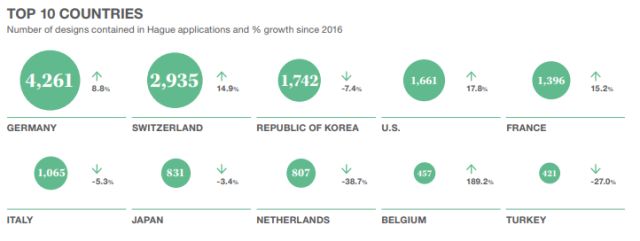
德国(4261件)仍然是国际外观设计体系中最大的用户;其次是瑞士(2935)、韩国(1742)、美国(1661)和法国(1396)。Top10来源国中,比利时(+189.2%)的增长最快,其次是美国(+17.8%)、法国(+15.2%)及瑞士(+14.9%)。
韩国两大电子巨头:三星电子(762)和LG电子(668)分别位列外观设计申请人排行榜的前两位。荷兰Fonkel Meubelmarketing(490)的申请数量减少了463件,导致其排名从2016年的第1下降至2017年的第3。宝洁(488)和大众汽车(369)分别位列第4和第5位。在装饰照明行业活跃的希腊Fotistika Abeeg公司以357件外观设计申请量位居第6,其上一年外观设计申请量仅为8件。

在外观设计中家具类申请占比最大(10.5%),其次是录音和通讯设备(10.3%),其中包括电脑设备和手机,以及交通工具(7.6%)。

附:英文参考
China Drives International Patent Applications to Record Heights; Demand Rising for Trademark and Industrial Design Protection
Geneva, March 21, 2018
PR/2018/816
China moved into the second position as a source of international patent applications filed via WIPO in 2017, closing in on long-time leader United States of America, in another record year in the use of WIPO's intellectual property services for patents, trademarks and industrial designs.
Two Chinese technology companies were the top filers of international patent applications in 2017, with Huawei (number one filer) and ZTE (number two) followed by Intel, Mitsubishi and Qualcomm.
Japan posted strong growth in 2017 but was nosed out of the second position by China, which at current trends is projected to overtake the U.S. within three years as the largest source of applications filed under WIPO’s Patent Cooperation Treaty (PCT) – a system that has helped to spread innovation worldwide since it began operations 40 years ago.
Overall, inventors from around the world filed 243,500 international patent applications via WIPO, 4.5% more than the previous year – driven by strong growth from China and Japan. Demand grew by 5% for WIPO’s international trademark filing service (the Madrid System), which saw 56,200 applications, while the number of industrial designs handled by WIPO’s Hague System for the International Registration of Industrial Designs grew by 3.8% to reach 19,429 designs contained in international applications. This marks the eighth consecutive year of growth for all three WIPO filing systems.
"This rapid rise in Chinese use of the international patent system shows that innovators there are increasingly looking outward, seeking to spread their original ideas into new markets as the Chinese economy continues its rapid transformation,” said WIPO Director General Francis Gurry. "This is part of a larger shift in the geography of innovation, with half of all international patent applications now originating in East Asia."
Patents
In 2017, U.S.-based applicants filed 56,624 PCT applications, followed by applicants from China (48,882) and Japan (48,208). Germany and the Republic of Korea ranked fourth and fifth, with 18,982 and 15,763 applications, respectively. China and India are the only two middle-income countries among the top 15 origins for PCT applications. Almost half of all PCT applications filed in 2017 came from Asia (49.1%), with Europe (24.9%) and North America (24.2%) accounting for a quarter each.
Among the top 15 origins, China is the only country to have recorded double-digit annual growth (+13.4%). China has now posted growth higher than 10% every year since 2003. Sweden (+7%) and Japan (+6.6%) also saw strong growth. In contrast, the Netherlands (-5.2%) and Italy (-4.5%) each saw a decrease in filings.
Two Shenzhen, China-based telecoms companies – Huawei Technologies (4,024 published PCT applications) and ZTE Corporation (2,965) – occupied the top two spots for PCT applications. Huawei reclaimed its lead over ZTE, the latter seeing a substantial drop in the number of published PCT filings in 2017. They were followed by Intel Corporation of the U.S. (2,637), Mitsubishi Electric Corporation of Japan (2,521) and Qualcomm Incorporated of the U.S. (2,163). The top 10 applicant list comprises seven companies from Asia, two from the U.S. and one from Europe.
Among educational institutions, the University of California was the largest user of the PCT System in 2017 with 482 published applications, extending a leading position it has held since 1993. Massachusetts Institute of Technology (278) ranked second, followed by Harvard University (179), the University of Texas System (161) and Johns Hopkins University (129),While the top 10 is dominated by U.S.-based institutions, the top 20 list includes 10 Asian universities. Coming in at 24th among the educational institutions is the highest-ranked European university: Oxford University Innovation Limited.
Computer technology (8.6% of the total) overtook digital communication (8.2%) to become the field of technology with the largest share of published PCT applications. These two fields were followed by electrical machinery (6.8%) and medical technology (6.7%), Among the top 10 technologies, transport (+11.8%), computer technology (+11.4%) and biotechnology (+9.6%) were the fields with the highest rates of growth in 2017.
Trademarks
U.S.-based applicants (7,884) filed the largest number of international trademark applications using WIPO’s Madrid System for the International Registration of Marks in 2017, closely followed by those located in Germany (7,316), China (5,230), France (4,261) and the U.K. (3,292).
Among the top 15 origins, China saw the fastest growth (+36.3%), followed by the Russian Federation (+23.9%), the Republic of Korea (+9.8%) and the U.K. (+9.3%). Both China and the Russian Federation recorded their second consecutive year of double-digit growth. In contrast, Austria (-4.9%), Italy (-6.6%) and the Netherlands (-5.8%) each saw a drop in filings.
L’Oréal of France with 198 applications headed the list of top filers, followed by Richter Gedeon Nyrt. of Hungary (117), ADP Gauselmann GMBH of Germany (104), and Swiss companies Novartis AG (96) and Abercrombie & Fitch Europe SA (82). Of note, Richter Gedeon Nyrt. filed 106 more applications in 2017 than in 2016, when it filed 11. The top 15 applicants list is comprised of 12 companies from Europe, two from Asia and one from the U.S..
The most-specified class in international applications, computers and electronics, accounted for 9.8% of the total, followed by services for business (7.9%) and technological services (6.2%). Among the top 10 classes, machines and machine tools (+13.4%) and services for business (+6.2%) saw the fastest growth.
Industrial designs
The number of designs contained in the applications filed under the Hague System grew by 3.8% in 2017 to reach 19,429 designs while the 5,213 applications represented a decrease as compared to the previous year. The increase in the number of designs completed 11 years of uninterrupted growth for the Hague System.
Applicants based in Germany (4,261 designs contained in their applications) continue to be the largest users of the international design system, followed by those in Switzerland (2,935), the Republic of Korea (1,742), the U.S. (1,661) and France (1,396). Among the top 10 origins, Belgium (+189.2%) saw the fastest growth followed by the U.S. (+17.8%), France (+15.2%) and Switzerland (+14.9%).
Two electronics giants from the Republic of Korea, Samsung Electronics (762 designs) and LG Electronics (668), ranked first and second respectively in the top applicants list. Fonkel Meubelmarketing of the Netherlands (490) filed 463 fewer designs, causing it to drop from the top applicant in 2016 to number three in 2017. Procter & Gamble (488) and Volkswagen (369) were fourth and fifth, respectively. I. Paleohorinos Fotistika Abee of Greece, which is active in the decorative lighting industry, ranked 6th with 357 designs. It filed only 8 designs in the previous year .
Furnishing (10.5%) accounted for the largest share of all designs, closely followed by recording and communication equipment (10.3%), which includes computer equipment and mobile phones, and means of transport (7.6%).
来源:IPRdaily综合中科院知识产权信息、WIPO官方网站
编辑:IPRdaily赵珍 校对:IPRdaily纵横君
推荐阅读
“投稿”请投邮箱“iprdaily@163.com”

「关于IPRdaily」
IPRdaily成立于2014年,是全球影响力的知识产权媒体+产业服务平台,致力于连接全球知识产权人,用户汇聚了中国、美国、德国、俄罗斯、以色列、澳大利亚、新加坡、日本、韩国等15个国家和地区的高科技公司、成长型科技企业IP高管、研发人员、法务、政府机构、律所、事务所、科研院校等全球近50多万产业用户(国内25万+海外30万);同时拥有近百万条高质量的技术资源+专利资源,通过媒体构建全球知识产权资产信息第一入口。2016年获启赋资本领投和天使汇跟投的Pre-A轮融资。
(英文官网:iprdaily.com 中文官网:iprdaily.cn)
本文来自中科院知识产权信息、WIPO官方网站并经IPRdaily.cn中文网编辑。转载此文章须经权利人同意,并附上出处与作者信息。文章不代表IPRdaily.cn立场,如若转载,请注明出处:“http://www.iprdaily.cn/”

 共发表文章4690篇
文章不错,犒劳下辛苦的作者吧
- 我也说两句
- 还可以输入140个字
